European Traffic Deaths
On September 21st 2016, there was a first incarnation of project EDWARD — European Day Without a Road Death. Coincidentally or not, on the next day Eurostat released the updated data of persons killed in road accidents.
In this article, we’ll take a look at the Eurostat data for a ten-year period from 2005 to 2014 (the data for 2015 is incomplete and largely missing), for 24 of the EU-28 countries —the data for Bulgaria, Lithuania, Malta, and Slovakia is missing.
Total traffic deaths
Each dot represents one country, horizontal blue line represents a median value for a given year, and 50% of values closest to median are inside of a box.
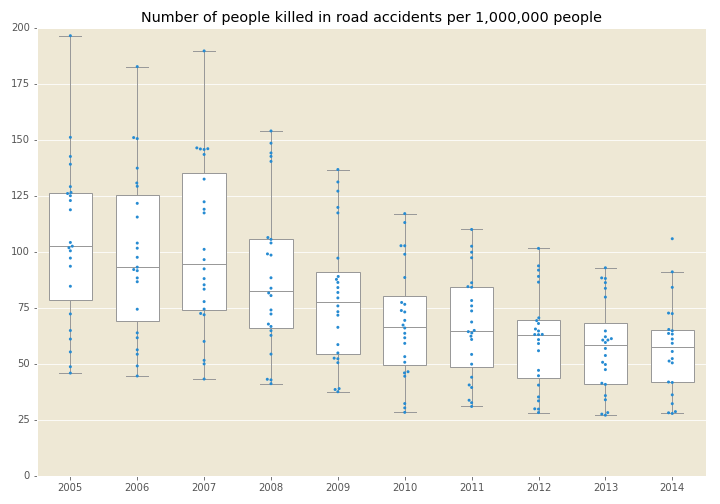
On average there were around 100 traffic deaths per 1,000,000 persons in 2005, and that number is constantly on the decline — in the last two years the average number was below 60 traffic deaths per million people. 2005’s average value is 2014’s outlier — a big improvement in ten years time.
If we take a look at data for each country, we can see large differences between them:
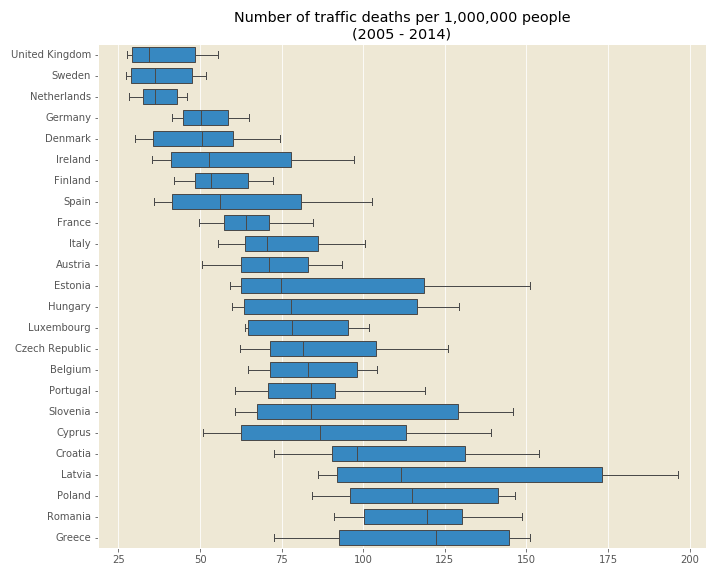
Northern countries have much safer road traffic than the rest of the Europe. First three countries on this list (UK, Sweden, Netherlands) have managed to have less than 30 traffic deaths per million people in the recent years.
Deaths by different traffic roles
Driver deaths make 64% of all traffic related deaths, passengers make 15%, and pedestrians make 21%. But the distribution is different across Europe:
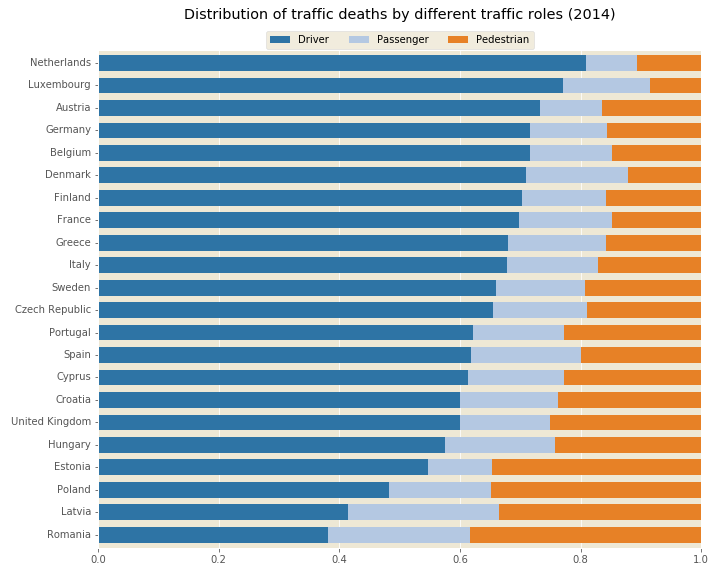
In Romania there are as many pedestrian deaths as there are driver deaths! For pedestrians it is 4.5 times more dangerous to be in Romania than in Luxembourg.
Pedestrian deaths
It is repeatedly said that pedestrians are the most vulnerable group of road users, but we often hear that a lot has been done in the recent years to increase pedestrian safety. Do the numbers confirm that?
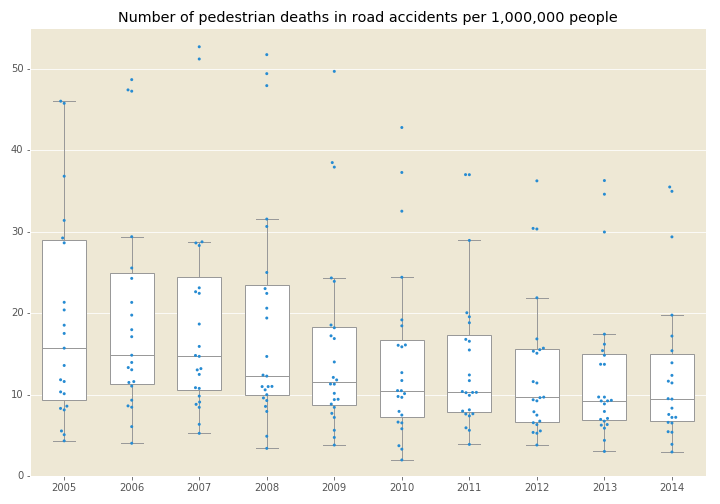
Looking at this graph, we can see that average number of pedestrian deaths per million people has decreased by 40% in 10 years. Impressive number by itself, but does it tell a whole story?
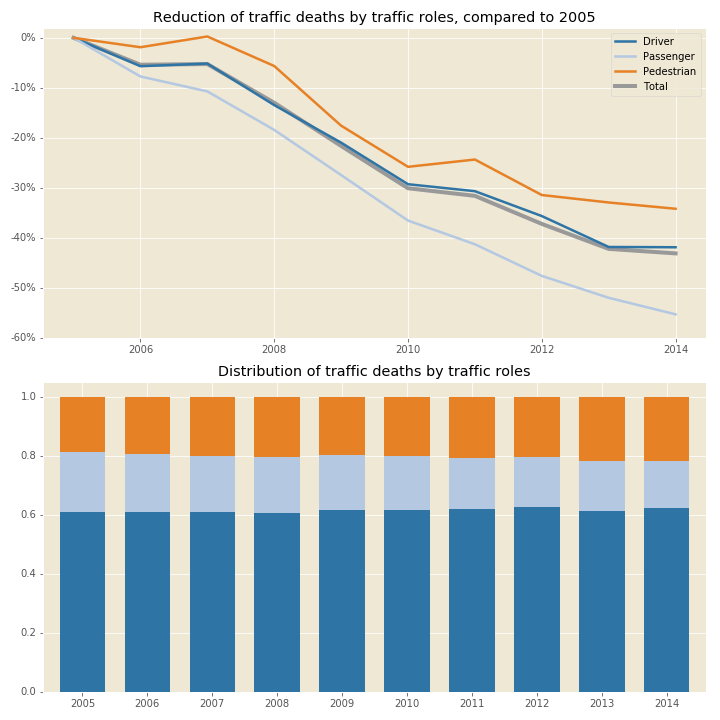
In those 10 years total number of traffic deaths decreased by 43%. On the bottom graph we see the share of pedestrian deaths in all traffic deaths has in fact increased by 16% (from 18.7% to 21.7%).
How is the situation regarding pedestrian safety in different countries?
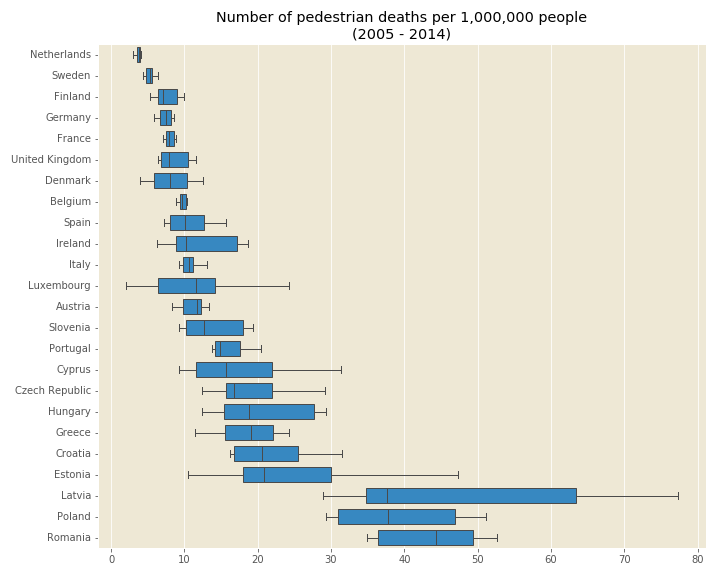
Romania, Poland, and Latvia have constantly much higher number of pedestrian casualties than the rest of the Europe — they are the only countries which have more than 20 pedestrian deaths per million people in the last four years.
Sex and age differences
It is known that males have higher traffic death rates than females, but how big is that difference?
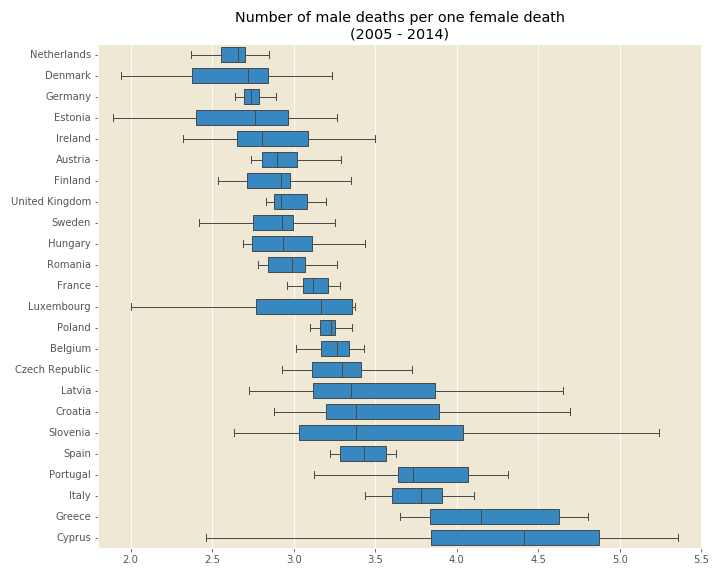
In northern countries there are less than 3 male deaths for every female death, compared to southern countries where it is not unusual to have more than 4 male deaths per one female death.
Car insurance is often more expensive for young and inexperienced drivers. Does this translate to more traffic deaths of younger population?
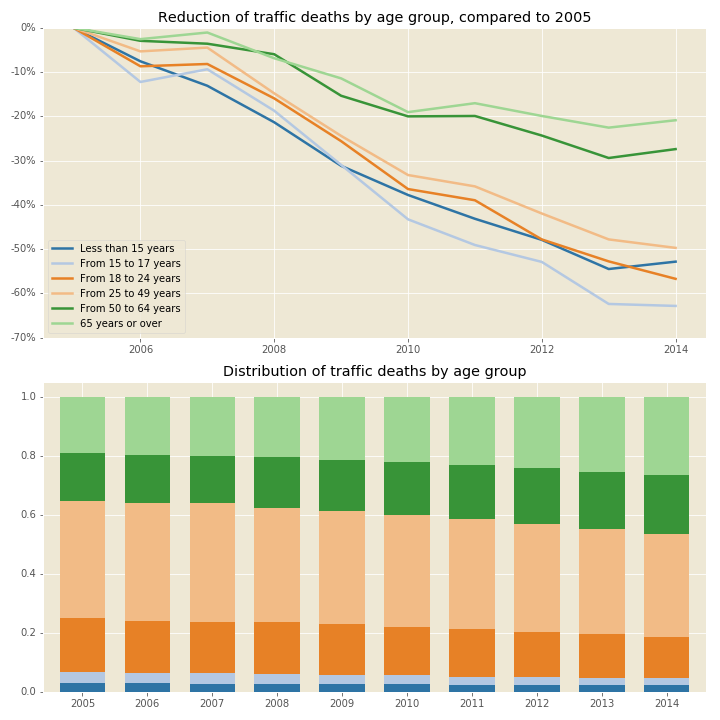
While the traffic deaths of people aged less than 50 years old decreased by 55% in ten years, the traffic deaths of people aged 50 or more decreased only 24% in the same time— they now account for 46% of all traffic deaths— that’s 30% increase from the values of the same age group in 2005.
Conclusion
Self-driving vehicles might be a future of road transport, but until that time comes, the road safety is in human hands.
The good news is that in ten-year period from 2005 to 2014 traffic related deaths in Europe have almost halved. The bad news is that despite the measures to increase pedestrian safety, their share in total number of traffic deaths has increased.
Many questions still remain unanswered because of limited data available. For example:
- males are 3-4 times more likely to be killed in traffic accidents than females, but there’s no information on how many drivers of each sex there are on the roads,
- is the number of traffic accidents on the decline, or are the accidents just getting less fatal,
- what is the distribution of traffic accidents and deaths depending on the age of the vehicles — are the newer vehicles safer,
- older age groups have become more vulnerable than before — did the age distribution of drivers change or are the new generations safer drivers than their predecessors?
Data preparation, analysis, and visualizations were made in Python. Source code is available here.